
Inbound marketing is all about transparency.
It's about educating your prospects, helping them to understand why you do what you do, and convincing them that your product or service is the best solution to their problems. Which is why we've decided to start doing a quarterly B2B inbound marketing report.
What's going to be covered?
Quite simply, each quarter we're going to review our HubSpot data and share the traffic and leads generated by our own inbound marketing strategy. This is part of an effort to demonstrate what inbound marketing could do for your business. In this first report we'll go back as far as September 2013, the month we became HubSpot certified.
We'll be reporting on:
- Website Traffic
- Blog Traffic
- Blog Subscribers
- Leads Generated
- Conversion Rates
- & More!
Without further ado, lets get started.
Website Traffic
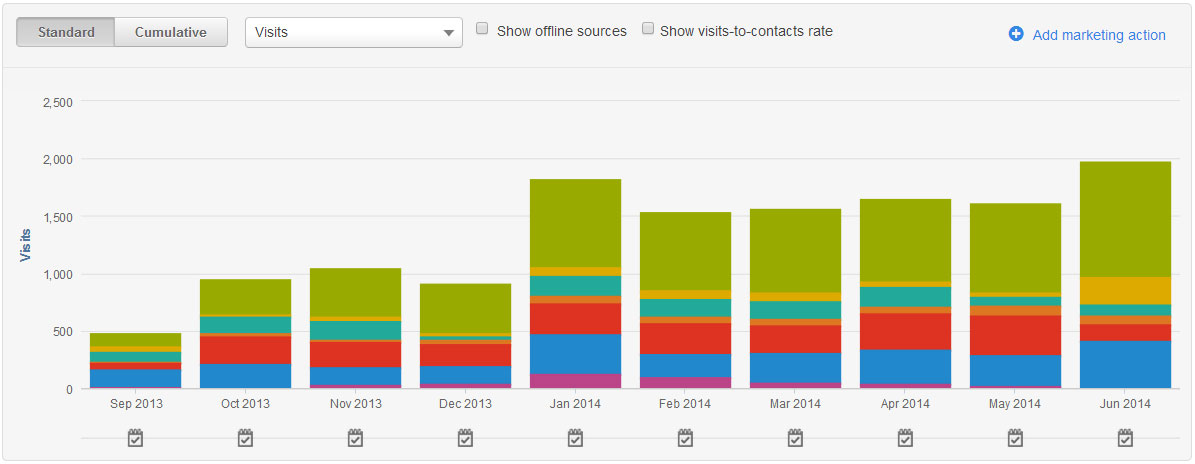
For those of you new to HubSpot traffic graphs, the green section of the bar is organic search traffic; yellow is referral traffic from other websites; turquoise is social media traffic; orange is email marketing traffic; red is pay per click traffic; dark blue is direct traffic and purple is any other campaign traffic.
Key Statistics
- Overall traffic up from 475 visits in September, to 1971 in June. A 315% increase.
- Organic search traffic up from 115 visits in September, to 1000 in June. A 679% increase.
- Email traffic up from 6 visits in September, to 79 in June. A 1216% increase.
- Direct traffic up from 152 visits in September, to 405 in June. A 166% increase.
Trends & Comments
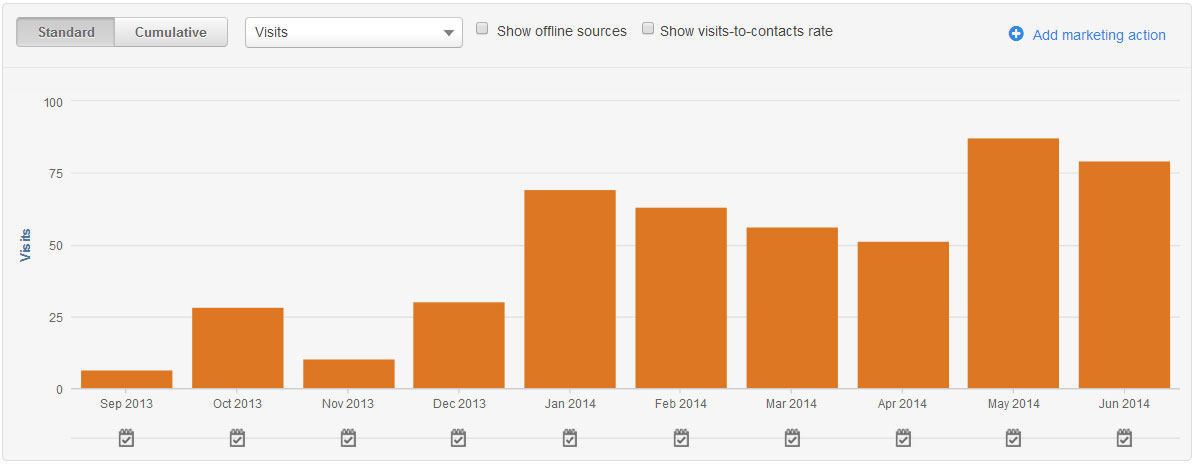
Our primary explanation for the upwards trend in overall traffic is our continual blogging effort. By blogging three times per week, we have seen a continual rise in organic search traffic, as shown isolated below:
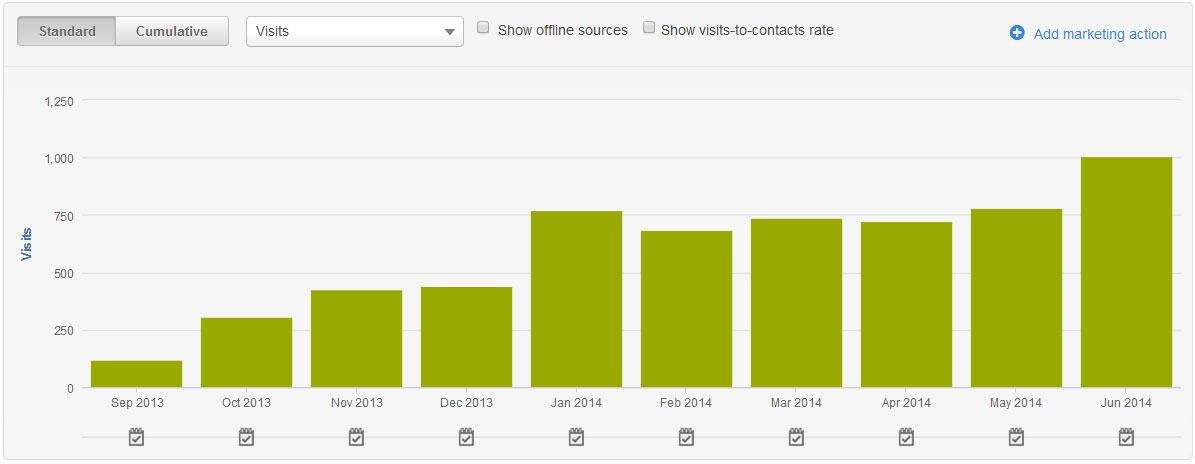
We're extremely pleased with that result.
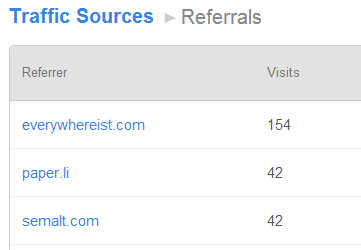
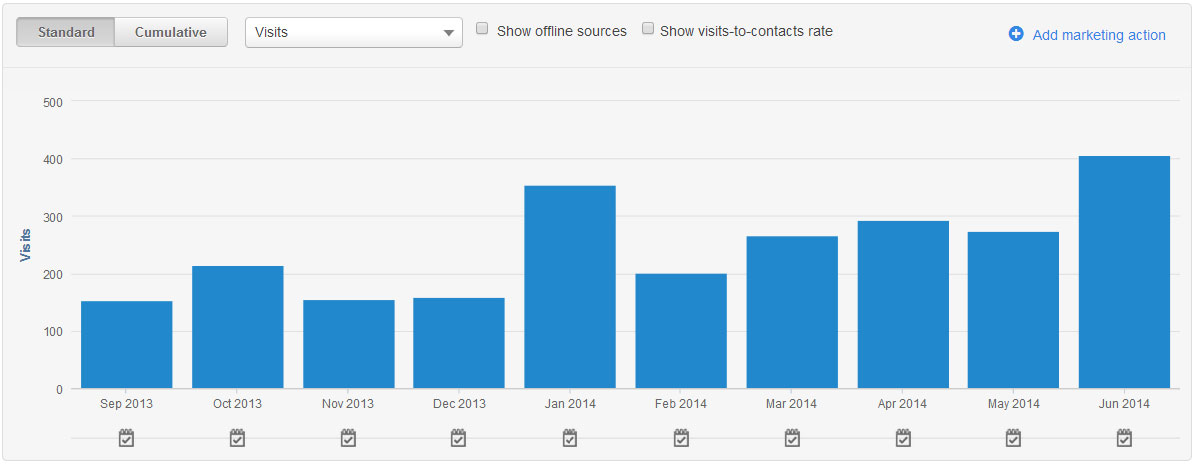
Another interesting trend we found was in our referral traffic:
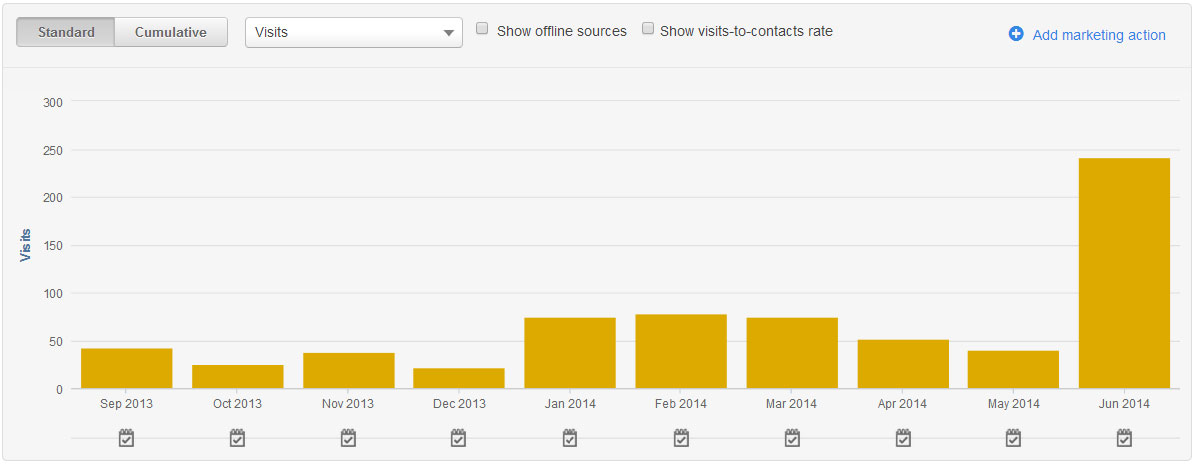
The big spike in June was a result of our blog post on writer's block being featured in a blog post on everywhereist.com (thanks, Geraldine!).
Traffic from email has also shown a steady increase over time, as the number of subscribers to our blog grows, and we collect more leads:
In terms of the email marketing we use, we have a series of 4 automated emails we send out to prospects after they download one of our top of the funnel eGuides, and another 4 automated emails if they download our middle of the funnel eGuide -- "How to Choose a B2B Marketing Agency". The only other emails we send currently are a monthly newsletter, and automated subscription emails to those subscribed to our blog.
We don't want to overload prospects with tons of unnecessary email, and like to think what we send is well targeted, and only to those who will find it relevant.
Our direct traffic also shows progress, indicating an increase in recognition of the Iconsive brand (direct traffic represents mostly visitors that type-in our web address, re-find us from bookmarks, and also the minority of people that block referral information):
Blog Traffic
Key Statistics
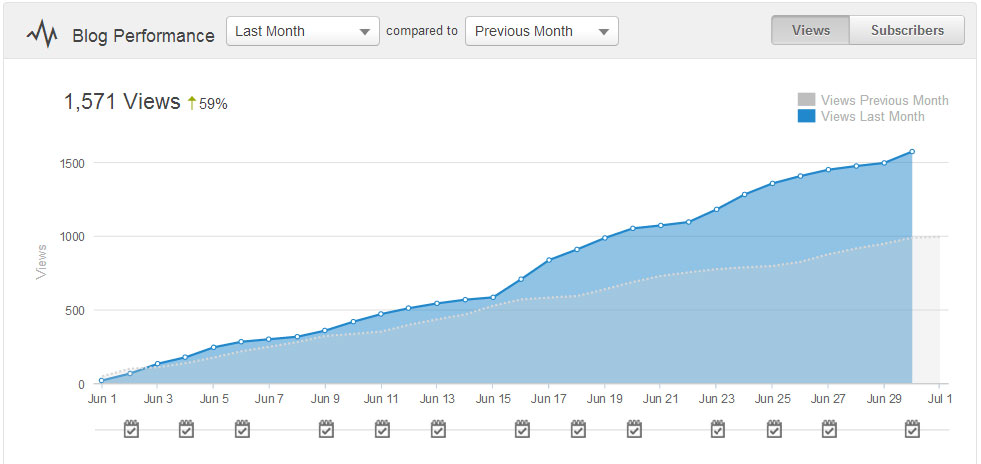
- Blog views were 59% higher in June, than May - a total of 1571 views.
- Blog views make up 63% of all pageviews on the Iconsive website in June.
- In April, blog views made up just 47% of all pageviews on the Iconsive website.
Trends & Comments
As the Iconsive blog has increased in authority and picked up more traffic, it's representing a larger percentage of the overall traffic to the Iconsive website. This is great, and indicates that our blogging strategy is working.
One of our major traffic sources is a pay per click campaign, which drives traffic to a landing page for Inbound Marketing: Explained. The increased percentage of blog traffic indicates a decreased reliance on pay per click traffic, and is a number we will be monitoring.
The more blog content we have published, and the more authoratative our blog becomes, the higher this percentage should go.
Blog Subscribers
Key Statistics
- At the beginning of April we had 54 subscribers. We finished June with 139. An increase of 157%.
- Blog subscriptions were lower in June. We added 10 subscribers during June, compared with 34 subscribers added in May.
Trends & Comments
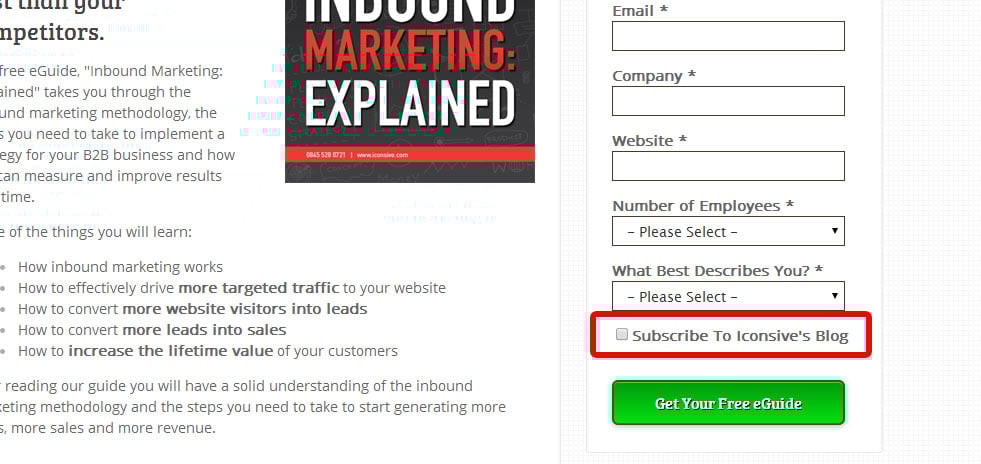
Overall we had good growth in blog subscriptions over the period, although perhaps we need to think of some new ways to promote subscribing to our blog throughout the site. Most of our blog subscribers subscribe when they tick a box when downloading one of our free eGuides, as shown on the screenshot below:
Due to running a reduced PPC budget during June, we generated less leads overall, which resulted in the lower number of blog subscriptions. I will discuss this more in the lead generation section, next up.
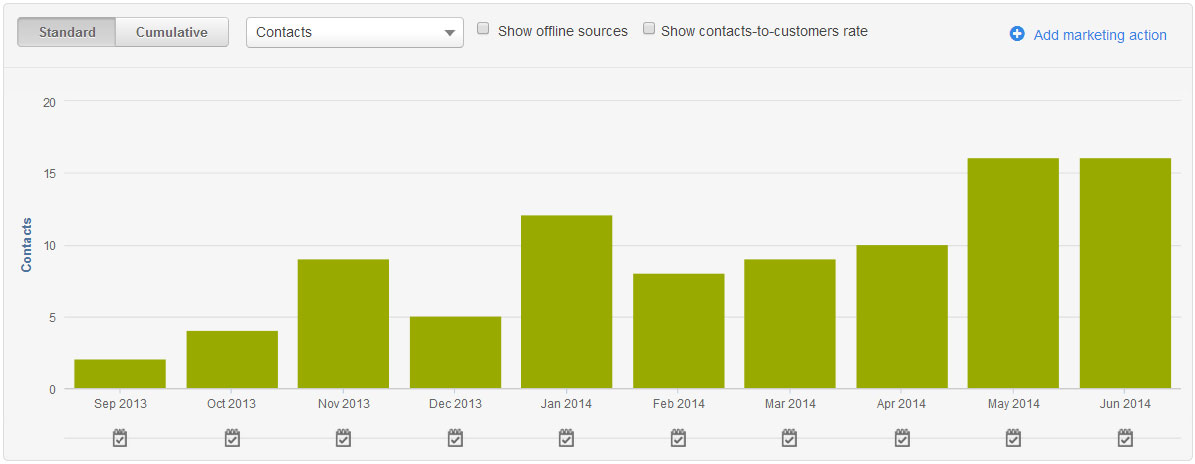
Leads Generated

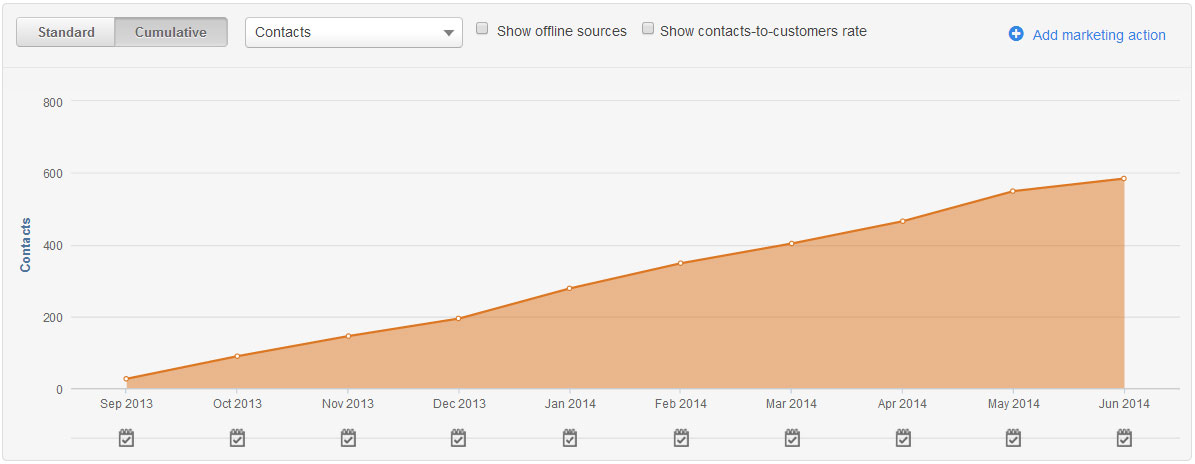
Key Statistics
- Started with 26 leads in our database in September, at end of June had 584. A 2164% increase in lead database size.
- In January, February, March, we generated 209 leads. In April, May, June we generated 181 leads. A 15% decrease.
- In June we generated 16 leads from organic search, up from 2 in September. A 700% increase.
Trends & Comments
Our lead database continues to grow month-on-month (as you'd hope!). A majority of our leads come from a pay per click campaign we run. At the end of June, 396 of our 584 leads originated from pay per click. The rest were from a mixture of organic search, direct, social media and referral traffic.
In june we paused our pay per click ads for 2 weeks. We also changed our campaign targeting in march to target different types of leads. Whereas originally our campaign was targeting business owners/directors, our new campaign also introduces marketing managers and sales managers. Introducing these new segments reduced our conversion rate on the traffic, but vastly increased the quality of the leads we are generating with pay per click.
For this reason, the drop in leads in the second quarter is not surprising.
One promising sign is that month-on-month the number of leads we generate via organic search is increasing:
In our experience the leads we generate from organic search make for better leads, as they are better informed. We expect our organic leads to keep increasing over the coming months, and reduce our need to invest in pay per click.
Our long term goal is to eliminate PPC, so we can rely exclusively on inbound channels to generate new business.
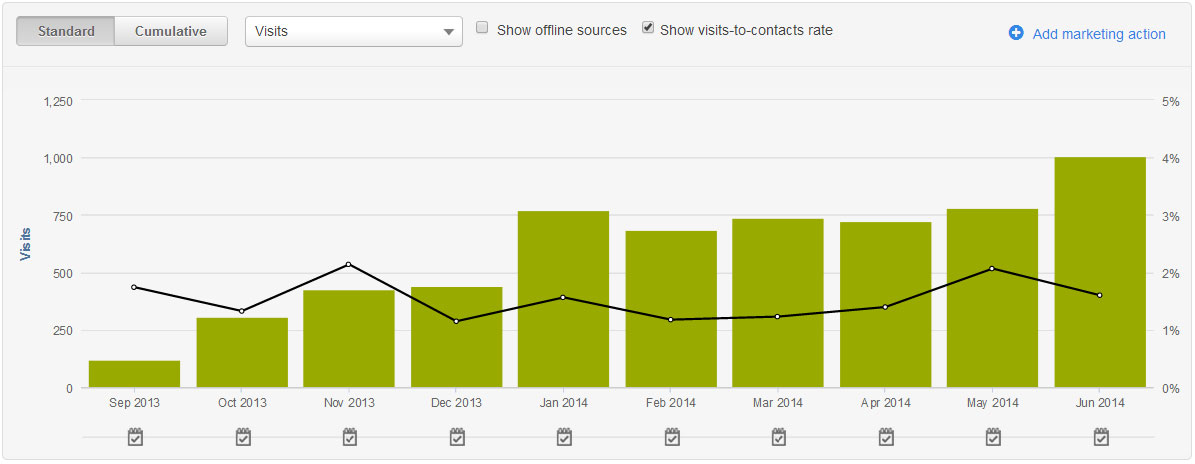
Conversion Rates
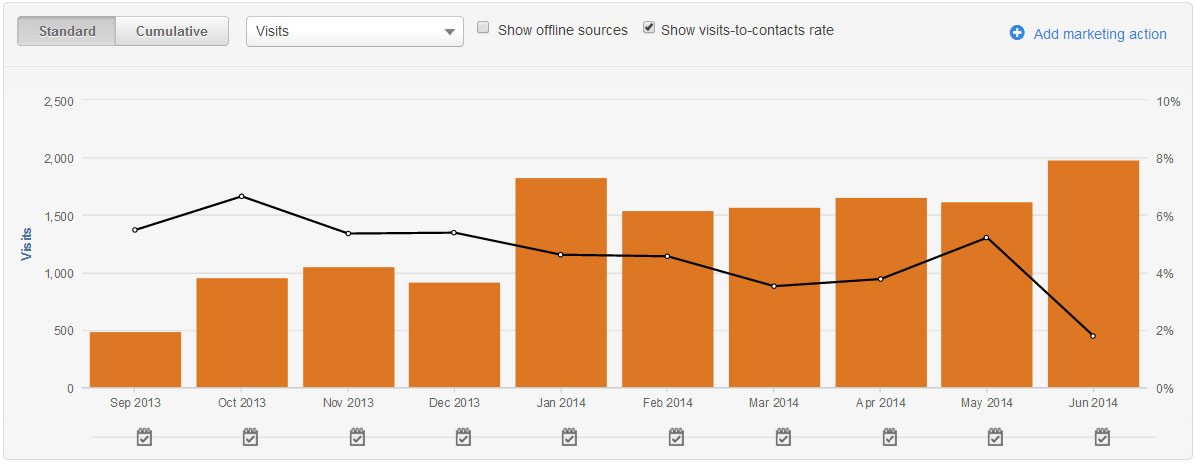
Trends & Comments
The black line on the graph above shows our conversion rate by month (% is on the right hand y-axis), with the orange bars representing the overall traffic each month. As expected, it trends down month-on-month. This is because as our blog grows in popularity, the PPC traffic that goes direct to our landing pages (and converts at a higher %) becomes a lower overall proportion of our overall traffic.
Overall conversion rates trending downwards are therefore perhaps surprisingly a positive indicator. They indicate that our traffic is growing and diversifing.
A graph we're keen to keep a close eye on is our pay per click conversion rate:
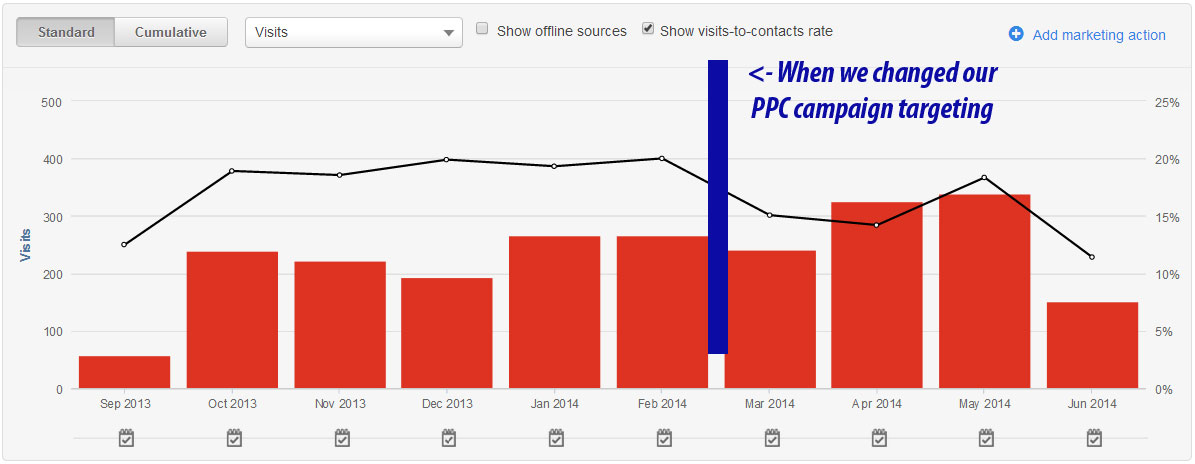
As can be seen, our conversion rates on pay per click traffic were pretty constant from October through February when we were primarily targeting business owners. When we adjusted our targeting in March, they dropped a bit. We aren't too bothered by this, as the new leads generated are better than the older leads in terms of quality. We recognise that we probably need to work on the campaign to improve conversion rates further.
Currently our PPC campaign targets two very different segments: both marketing & sales team members. By splitting the campaign into two, and creating landing pages optimised for the individual segments, we might be able to improve conversion rates on our paid traffic once more, for example. (Perhaps even exceed our previous highs).
Another graph we pay lots of attention to is our monthly organic search traffic conversion rate:
We're pretty happy with these conversion rates at the moment (1.5-2%), as it's fairly standard for organic traffic in our sector. Over time as we build up a collection of more relevant eGuides, landing pages and other content for our visitors to consume, we're expecting to improve on this further. Our next conversion rate goal is to get our organic search traffic converting consistently above 2%, although this goal comes second to our traffic generation goals.
Currently it makes more sense for us to focus on traffic (improving from 1.5% to 2% conversion rate when you have 1,000 visits per month from search is only 5 new leads per month). As we get closer to our long term goal of 10,000 visits per month from search, then that 0.5% difference becomes much more significant.
So there we have it. Our numbers out on the table for everyone to see. If you're interested in having a chat with us about how inbound marketing could help your organisation to grow, why not request a free assessment? If you're new to the concept of inbound marketing, then check out our free eGuide by filling in the form below.

