Customer churn is bad.
As a statement, that's uncontroversial. But for all its truth, it's also pretty unhelpful. As any SaaS founder knows, some degree of churn is unavoidable - there'll always be customers that cancel their subscription, because of failed payments, cashflow crises or plain unhappiness.
That leads into an obvious question: how much churn is too much?
Most of the studies into SaaS churn rates are confusing or contradictory, so to simplify matters, I've put together a meta-analysis of the 6 best SaaS churn rate studies I could find.
The results aren't what I expected.
Last updated: June 2024
Churn Rate Benchmarks
The Mythical 5% Benchmark
There are lots of opinions about "ideal" SaaS churn rates, and most commentators seem to share the same view:
...an acceptable churn rate is in the 5 – 7% range ANNUALLY, depending upon whether you measure customers or revenue.
Lincoln Murphy, Sixteen Ventures

When you look at the maths involved, the logic behind this opinion becomes immediately obvious.
If we assume a startup has 1,000 customers, a 5% annual churn rate would result in the loss of 50 customers over the course of a single year - not ideal, but easy to compensate for with new customer acquisition.
If we compare that to a 5% monthly churn figure, the same startup would lose 460 customers over the course of a year - making it necessary to replace almost half of their entire customer base, each year, just to "break even".
Monthly vs Annual Churn
 The stark difference stems from the fact that monthly churn compounds over time. Whereas 5% annual churn is measured over the entire year...
$$1,000*0.95=950$$
...5% monthly churn reduces the customer count by an additional 5%, each and every month:
$$\text{January: }1,000*0.95=950$$
$$\text{February: }950*0.95=903$$
$$\text{March: }903*0.95=857$$
$$\text{...}$$
$$\text{December: }569*0.95=540$$
Both annual and monthly churn show the same information (customers lost), but over different time periods. To add to the confusion, there's no standardised way to report churn rates: many of the surveys here report annual customer churn, while others report monthly churn.
Theory Meets Practice
To simplify things, we can use the following formulae to convert annual to monthly churn, and vice versa.
$$\text{Monthly Churn Rate }=1-(1-\text{ Annual Churn Rate})^{1/12})$$
$$\text{Annual Churn Rate }=1-(1-\text{ Monthly Churn Rate})^{12})$$
Using the formula above, our "ideal" annual churn rate of 5 - 7% is equivalent to a monthly churn rate of just 0.4% - a loss of roughly 1 in every 200 customers.
$$\text{Monthly Churn Rate }=1-(1-0.05)^{1/12})=0.4%$$
But ask any SaaS founder about their churn rates, and chances are, they'll have a monthly churn rate far higher than 0.4%. So does that mean there's a churn epidemic, sweeping through the SaaS world?
Or is our "ideal" churn target simply unrealistic?

1) Pacific Crest Survey
Respondents
Pacific Crest's annual survey is the go-to SaaS metrics data set, and their 2016 survey offers insight into the performance metrics of 336 SaaS companies - 177 of which reported their churn rates.
To get an idea of the types of SaaS companies featured, Pacific Crest also provide a few representative statistics. The companies in their survey have a:
- Median yearly revenue of $5 million.
- Median of 50 full-time employees.
- Median ACV (Average Contract Value) of $25,000.
Reported Churn Rate
Looking at the study itself, customer churn rates (referred to as "unit churn") are reported in different "bands", ranging from 1-3% up to greater than 15%.
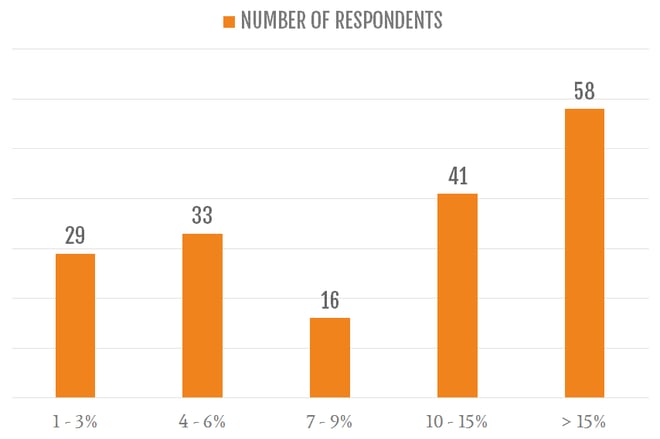
Pacific Crest reported the median annual churn rate across the entire sample as 10%, or 0.87% per month.
This figure is higher than our "ideal" churn rate, but that's to be expected: an ideal figure is a benchmark that not all companies will achieve.
Though the use of banded data makes it hard to pinpoint the exact number of companies that fell without our ideal range of 5-7%, we can say that a maximum of 78 of the 177 respondents (44%) had churn in (or better than) this range.
Though the "greater than 15%" churn band was the biggest, our ideal figure still sounds plausible.
2) Totango Metrics Report
Respondents
Like Pacific Crest, Totango also put out an annual SaaS metrics report.
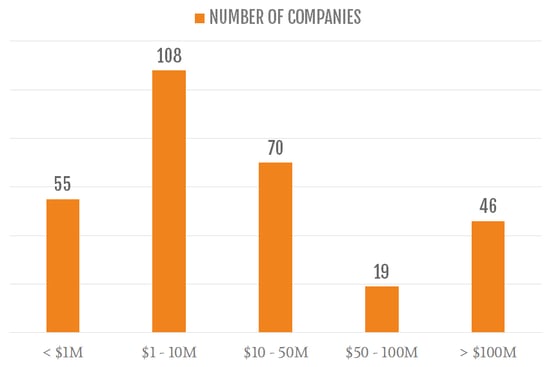
Their survey targets a broader range of businesses ("ranging from early-stage startups to established businesses with over $100M in revenue"), but the majority of respondents (60%) fell between $1 and $50 million yearly revenue.
Reported Churn Rate
Totango looked at annual churn rates across three different "types" of company:
- High growth (those that saw a greater than 75% year-on-year revenue increase).
- Medium growth (25% - 75%).
- Low growth (less than 25%).
Churn was then reported across three broad categories:
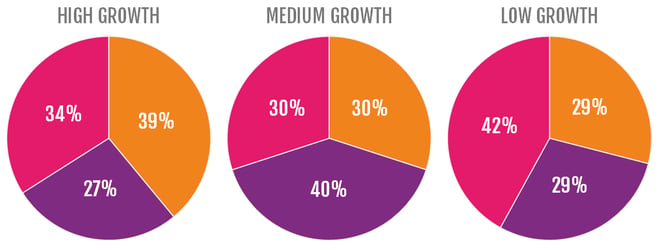

If colorful pie charts aren't your thing, here's a handy table of their findings:
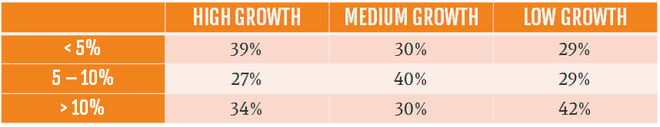
Like the Pacific Crest survey, big and vague churn bandings mean solid conclusions are few and far between (both 11% and 99% churn would be reported in the "greater than 10%" category), but it's fair to say that:
- Churn rates of less than 5% annually are not uncommon, particularly in high-growth SaaS companies. Roughly one third of respondents were in this category.
- The majority of SaaS companies (65%) reported churn rates of 10% or less annually - in keeping with the findings of the Pacific Crest survey.
3) Blossom Street Ventures
Respondents
Early last year, Blossom Street Ventures analysed 40 publically traded SaaS companies, in an attempt to learn about their churn rates.
The companies ranged from $75 to $382 million in trailing twelve-months revenue, and featured the likes of HubSpot, Zendesk and Box (in other words, about as big as SaaS companies come).
Reported Churn Rate
Only 16 of their chosen companies reported churn figures. Of those that did, the majority seemed to report revenue churn (explaining how the median retention value was 105% - only possible as a result of negative revenue churn).
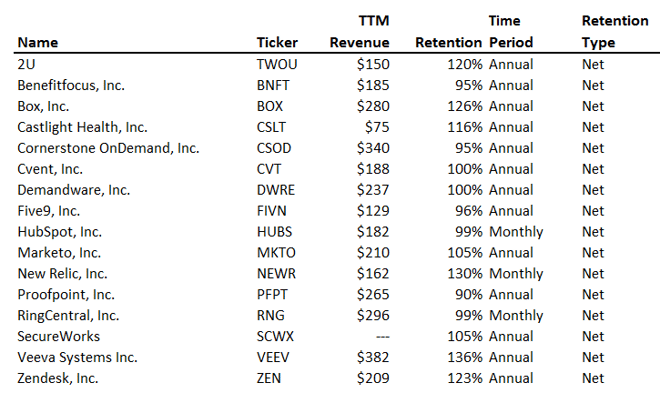
Of those 16 companies, only 6 reported retention of less than 100% (making it possible that they were referencing customer churn, instead of revenue).
Of these, the lowest figure reported was 99% monthly retention. Assuming this to be customer churn (it's hard to tell from the data alone), the company in question would have 1% monthly churn, or 11.3% annual churn.
Though it's hard to draw conclusions from the data, we can at least say that the highest possible annual churn rate reported was just over 11% - with all other companies reporting lower churn. This seems to corroborate Totango's and Pacific Crest's findings.
4) Baremetrics' Benchmarks
Respondents
So far, the story has been relatively consistent: most SaaS companies seem to have a churn rate in the region of 10% annually, equivalent to less than 1% monthly.
Unfortunately, this is where things start to deviate.
Baremetrics is an analytics platform designed for SaaS companies. On it's Benchmarks page, the company uses its insight to pool together real-time dashboard analytics from over 600 small-to-medium sized SaaS companies - including customer churn rates.
Reported Churn Rate
Baremetrics focuses on monthly customer churn, and reports on average monthly churn rates across cohorts of companies with similar ARPA (Average Revenue per Account) values.
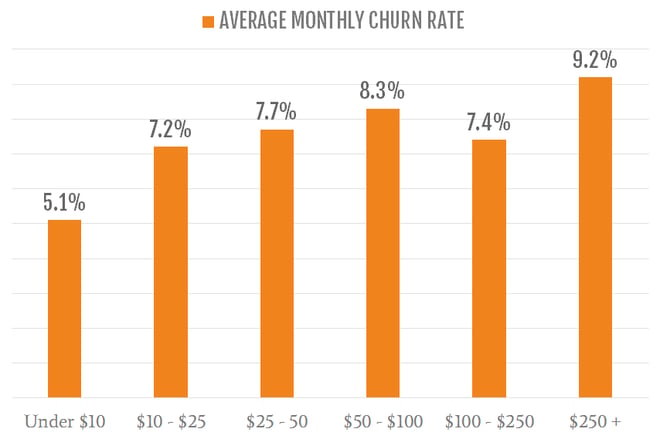 If we average across these cohorts, we find a monthly churn rate of 7.5%.
Annualised, that's equivalent to 61% churn - roughly six times higher than the average reported by Pacific Crest, Totango and Blossom Ventures.
That's a huge discrepancy, and completely at odds with a 5-7% annual churn target - but crucially, these findings are backed-up by a few other data sources.
5) Groove's SaaS Survey
Respondents
Back in 2013, Groove conducted their own research into the SaaS industry. Their survey focused on small businesses, garnering responses from 712 SaaS companies, all post-Product/Market Fit and between $1,000 and $500,000 in MRR.
Reported Churn Rate
I can't find any mention of the raw data, but Groove reported the average monthly churn across the entire sample: 3.2% monthly churn, or annualised, a 32.3% churn rate.
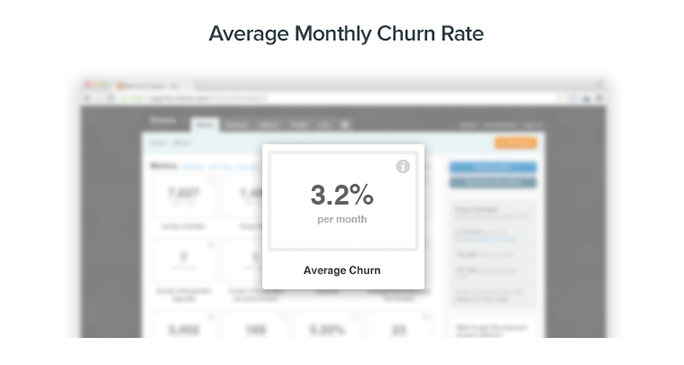
Though roughly half the size of the average churn rate reported by Baremetrics, this result is still of the same order of magnitude, and a far cry from the sub-1% monthly churn rates we've seen reported in the other data sets.
6) Open Startups
Respondents
Editor's note: Buffer no longer uses Baremetrics, and unfortunately fewer Startups publish their dashboards publicly in 2024, but this data is still highly relevant to a SaaS Startup today.
To dig one step further, we can turn to the individual SaaS startups that use Baremetric's reporting functionality.
Of the 600 companies that use Baremetrics, 18 companies currently make their dashboard data public, and they range in size from $447 in MRR (Helpman) to $1,078,560 (Buffer).
Reported Churn Rate
Buffer are the most high-profile users of Baremetrics, and their latest figures report 5.1% monthly churn (or ~46% annual churn).
Buffer is a big, successful SaaS company, so the idea that they're losing 46 out of every 100 customers each year seems shocking, especially when contrasted with the average churn rates reported by Pacific Crest and Totango.
But it's a statistic that's borne out by their own cohort analysis:
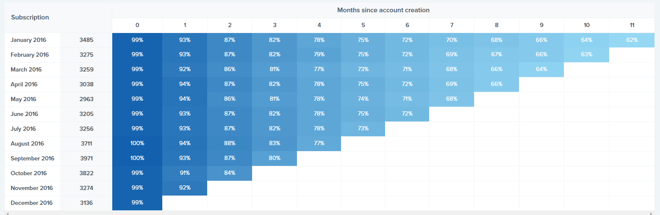
According to their actual cohort data, only 62% of the customers that signed up in January 2016 were still customers at the start of 2017. For this particular cohort, that's an annual churn rate of 38% (and February's cohort looks to be worse).
These figures are echoed across the board, making the Baremetrics' average of 7.5% monthly churn seem very plausible:
- Baremetrics themselves report 5.8% monthly churn (51% annually)
- Time-tracking SaaS HubStaff show 5.6% monthly churn (50% annually)
Editor's Note: HubStaff no longer have a public Baremetrics dashboard (2024) - Email marketing tool ConvertKit report 8% monthly churn (63% annually).
The Churn Rate Problem
Six studies in, and we have a clear churn dichotomy: one set of studies seems to suggest that a 5-10% annual churn rate is common; another, a 5-10% monthly churn rate.
So what's happening?
1) Company size
The different data sets fall into two categories: less than $1,000,000 MRR (Baremetrics, Groove, Open Startups), and greater than $1,000,000 MRR (Pacific Crest, Totango, Blossom Ventures), or broadly speaking, big and small.
The "ideal" churn rate of 5-7% annual churn does seem to hold true for the larger SaaS companies, but smaller companies seem to have much higher churn.
This is probably because most "big" (and definitely most public) SaaS companies target enterprise customers, which has a huge impact on churn:
- Annual billing and longer contract lengths make it harder to churn.
- Higher ACV means decisions are generally viewed as more "long-term".
- Enterprise companies are less price sensitive than smaller companies.
Compare this to the SMBs that most smaller SaaS companies target, and the huge differences in churn become understandable:
- Monthly billing and shorter contracts make it much easier to churn.
- Lower ACV makes it easy to switch between products.
- Cashflow volatility can lead to frequent cancellations.
2) INDUSTRY-SPECIFIC PRICE SENSITIVITY
In the same way that certain types of customer are more prone to churn, different types of software will have different predispositions to churn.
Look through your own tech stack, and you'll likely see some products you view as essential, and others deemed "nice-to-have". It's likely that a finance or sales tools will be less susceptible to churn than a marketing tool, simply because it's perceived to be more directly responsible for revenue.
The same is true of niche tools, or those with few competitors - the more expensive it would be to change to another tool, the lower your churn rate will be.
3) INCONSISTENT DATA
There isn't a whole lot of churn data available - and the information I did find isn't always that clear-cut.
There's a simple reason for that: high churn rates are bad, literally recording how many customers are up-and-leaving your service each month. Few companies are as brave as Buffer and HubStaff, and those that do agree to share churn rates will likely only do so if it's anonymous, and the exact data is hidden away with a range.
4) Intentional Obfuscation
Public companies have an even greater incentive to hide "bad" metrics: it can impact their stock price.
By law, public companies have to report on their performance. Adopting industry-standard measures (like GAAP) would make it easy to compare between similar companies, leading many to develop "proprietary" reporting methods that make it next-to-impossible to directly compare between competitors.
And despite its importance, there are no legal requirements to report on churn rates - leading to the low response rate and the dozens of different churn rate calculations used in the Blossom Ventures report.
Your Ideal Churn Rate
If you're a big, established SaaS company, on track for IPO or some other type of exit, your churn rate targets are crystal clear: you need to hit 5-7% annual churn.
It's a consistent hallmark of big, successful companies, and we've seen good reason to suggest you'll need similar to reach their heady heights.
But if, like most SaaS companies, you're earlier-stage, things aren't so clear. Even a successful SaaS company like Buffer still battles with 5% monthly churn rates, and if you're new to the world of Product/Market Fit, there's reason to believe those churn rates will be higher.
Though it's hard to give a precise benchmark, the six studies I've analysed suggest the same thing: a 5% monthly churn rate is pretty common, and as evidenced by the likes of Buffer, Baremetrics and Convertkit, not a clear-cut barrier to growth.
A typical “good” churn rate for SaaS companies that target small businesses is 3-5% monthly. The larger the businesses you target, the lower your churn rate has to be as the market is smaller.
For an enterprise-level product (talking $X,000-$XX,000 per month), churn should be < 1% monthly.
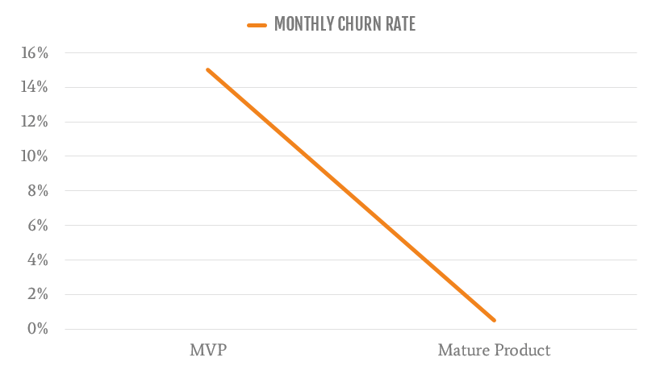
Most early-stage SaaS companies I’ve observed typically have churn around 10-15% for the first year as they work out exactly what their product needs to do, then they’re able to reduce it pretty quickly.
Baremetrics' Academy
Key Takeaways
- Churn is bad but inevitable, so it's important to track and improve your churn rates over time.
- 5 - 7% annual churn is a great benchmark to aim for - if you're an established, mature SaaS company, primarily targeting the enterprise.
- If you're earlier-stage, or targeting SMBs, expect churn to be closer to 5% per month.
- As your product continues development and your business model matures, you should get better and better at closing and retaining good fit customers. In other words, your churn rate should improve over time.
- Absolute churn rates aren't as important as changes in churn rates, and you're heading in the right direction if your progression looks something like this: