
SaaS metrics provide answers to important questions: how can we increase customer acquisition? How profitable are our customers? What do we need to do before we pitch our next funding round?
But the trouble is, many companies track the wrong SaaS metrics, in the wrong way, or worse still, overlook crucial metrics entirely. Instead of using metrics as a valuable aid to performance, they end up confusing the picture.
To help you understand and improve your performance, I've put together a comprehensive guide to 50 essential SaaS metrics (loosely divided into Growth, Marketing, Sales and Customer Success).
For each of the 50 metrics, we'll look at:
- What they are, and why they matter.
- How to calculate them for your own SaaS company.
- Benchmarks to guide your performance.
- Advice from founders and investors.
This resource was last updated in December, 2024.
SaaS Growth Metrics
Paul Graham, Y Combinator
Startups are so hard that you can't be pointed off to the side and hope to succeed. You have to know that growth is what you're after. The good news is, if you get growth, everything else tends to fall into place. Which means you can use growth like a compass to make almost every decision you face.

SaaS growth metrics are designed to analyse the "momentum" of your business as a whole: your ability to grow, and keep growing.
Think of them like the heartbeat, blood pressure and temperature of your company: the core indicators that reveal the health of your subscription business at its most fundamental level.
By combining together elements of sales, marketing and customer success, these metrics provide a clear indication of your overall performance, in a handful of key figures (it's for that reason they often form a crucial part of any investor's due diligence).
Getting to grips with these SaaS metrics will help you to:
- Understand how your business is developing, and where performance can be improved.
- Create a dashboard of at-a-glance SaaS metrics to stay on top of your company's health and performance.
- Communicate the value of your growing business to would-be investors.
1) Monthly Recurring Revenue (MRR)
SaaS businesses are subscription-based, and the recurring nature of this payment model makes it relatively easy to track and forecast revenue, in a way that other business models struggle to do. That's where MRR comes in: we can work out the amount of predictable revenue generated by our customers each month, known as Monthly Recurring Revenue.
MRR is essential for understanding the growth of your business, and with a good handle on customer acquisition and churn rates (which I'll cover below), we can even use it to extrapolate to the future, and predict future revenue.
$$\text{MRR}_t=\sum\text{Recurring Revenue}_t$$
The basic formula for MRR is pretty simple: for any given month (period t), simply sum up the recurring revenue generated by that month's customers to arrive at your MRR figure.
In the following example, in January we have 2 customers, each paying a monthly subscription of $2,000. In February, we gain an additional customer, and MRR increases as a result. In March, we gain a further customer:
$$\text{January: }2000+2000=4000 \text{ MRR}$$
$$\text{February: }2000+2000+2000=6000 \text{ MRR}$$
$$\text{March: }2000+2000+2000+2000=8000 \text{ MRR}$$
The one metric that I look for is the basic MRR...
Every SaaS company should live and die by MRR, because that’s something that you can’t go without.
Mamoon Hamid, Social Capital

2) Annualized Run Rate (ARR)
ARR stands for Annualized Run Rate (I've also seen it referred to as Annual Recurring Revenue). In simple terms, it's the recurring revenue generated by your SaaS business over the course of a year:
$$\text{ARR}=\text{MRR}\times12$$
Most SaaS businesses generate the majority of their revenue from monthly subscriptions, making MRR the clearest indicator of revenue generation. However some businesses deal primarily in yearly contracts, making ARR an easier and clearer metric to use.
Dave Kellogg, Host Analytics
...most enterprise SaaS companies should use annual recurring revenue (ARR), not monthly recurring revenue (MRR), because most enterprise companies are doing annual, not monthly, contracts...

3) Customer Churn
As a subscription-based business, your growth depends on new customer acquisition, and crucially, minimising the loss of your existing customers. Customer churn (often referred to as "Logo Churn") measures the rate at which your existing customers cancel their subscription to your service.
$$\text{Customer Churn Rate}=\frac{\text{Customers that churned in period t}}{\text{Total customers at the start of period t}}$$
For example, if we start January with 20 paying customers, but finish the month with only 19, the customer churn rate for January alone was 5%:
$$\text{Customer Churn Rate}=\frac{20-19}{20}=5\%$$
Annual customer churn rates
It's important to track both monthly and annual customer churn rates, for one very simple reason: reasonable sounding monthly churn can quickly turn into crippling annual churn.
For example, I've seen multiple estimates for a target annual churn of 5-7% - using the formula below, that translates to roughly 0.5% monthly churn, or a loss of 1 customer in every 200.
$$\text{Annual Customer Churn Rate}=(1-(1-\text{Monthly Churn Rate}))^{12}$$
$$6\%\approx(1-(1-0.005))^{12}$$
In contrast, a relatively harmless sounding 5% monthly churn rate translates into a massive 54% churn rate over the course of the year:
$$\text{Annual Customer Churn Rate}=(1-(1-0.05))^{12}\approx54\%$$
This is useful for extrapolating annual churn from a single monthly churn figure, but if you have 12-months of data, you can use that to calculate the year's exact customer churn figure:
$$\text{ACCR }=1-(1-m_1)\times(1-m_2)\times...\times(1-m_{11})\times(1-m_{12})$$
Customers That Can't Churn
Lincoln Murphy, Sixteen Ventures
Those that are otherwise bound by a contract couldn’t churn this month, so if we figure them into our churn calculation, we might look like we’re doing better than we actually are.

Each month, there's likely to be a portion of your customer base that is currently unable to churn: typically because they're still bound by their contract (let's say you offer a monthly rolling contract with a 3-month minimum committment).
Factoring these people into your churn statistic will actually under-report your real churn rate, so it's a good idea to exclude these people from your calculations:
$$\text{Customer Churn Rate}=\frac{\text{Churned customers}_t}{\text{Starting customers}_t-\text{Bound customers}_t}$$
Churn Cohorts
Similarly, measuring churn isn't a goal in its own right: we want to understand the why behind churn, and fix it. By grouping together customers with similar attributes (such as month joined, or the length of time they've been a customer), we can create churn cohorts to try and identify the triggers that cause high churn.
Christoph Janz, The Angel VC
Cohort analyses are the only way to get a good understanding of retention and customer lifetimes.

4) Revenue Churn
Revenue churn (also referred to as "MRR churn rate") is used to look at the rate at which monthly recurring revenue (MRR) is lost, as a result of lost customers and downgraded subscriptions.
$$\text{Revenue Churn Rate}=\frac{\text{MRR}_{t-1}-\text{MRR}_t}{\text{MRR}_{t-1}}$$
For example, if we generate $5,000 MRR during January, but as a result of our earlier lost customer, only $4,750 during February, that month's revenue churn is $250, or 5%:
$$\text{Revenue Churn Rate}=\frac{5,000-4,750}{5,000}=5\%$$
Negative revenue churn
The examples above are pretty simple: 5% customer churn resulted in 5% revenue churn. In reality though, different pricing packages, and additional seats, users and storage, can make churn calculations much more complicated.
For example, imagine we were able to upsell 4 of our current customers to a higher priced package, for an additional $250/month.
Though our customer churn rate stays the same, the month's revenue churn is actually negative: in spite of losing a customer, our upselling has lead to higher revenue than the previous month:
$$\text{Customer Churn Rate}=\frac{20-19}{20}=5\%$$
$$\text{Revenue Churn Rate}=\frac{5,000-5,750}{5,000}=-15\%$$
5) Bookings
Bookings records the total value of all new deals obtained over a time period. Crucially (and unlike MRR), Bookings figures make no distinction between up-front and recurring payments.
$$\text{Bookings}_t=\sum\text{Value of New Deals}_t$$
For example, if a customer purchased a year's subscription for $24,000, that month's bookings figure would be $24,000, but the month's MRR would be $2,000 ($24,000 / 12).
As a general rule, tracking Bookings is a useful way of measuring cashflow, but MRR is more helpful for measuring revenue growth over time.
The way we’ve measured “Revenue” has been to take the total revenue we generated in the month, and use that. For “Annual revenue run rate,” we simply multiplied monthly revenue by 12.
Our revenue includes people who pay us on a monthly basis and also those who pay for the whole year in advance. This is where the miscalculation lies.
As a recurring revenue (SaaS) business, we can’t guarantee we will get the same number of people paying for annual subscriptions month after month, and we are counting revenue that is in the future. The correct way is to ‘amortize’ and divide those annual payments by 12.
In this way, we’re only counting the next 12 months of actual recurring revenue we have already acquired.
Joel Gascoigne, Buffer

6) MRR Growth Rate
The MRR Growth Rate is extremely useful for measuring the improvement of your revenue generation over time.
$$\text{MRR Growth Rate}=\frac{\text{MRR}_t-\text{MRR }_{t-1}}{\text{MRR }_{t-1}}\times100$$
For example, if we generated $1,500 MRR last month, and increased that to $2,000 this month, we'd have an MRR Growth Rate of approximately 33%:
$$\text{MRR Growth Rate}=\frac{2000-1500}{1500}\times100\approx33\%$$
A steady month-on-month MRR Growth Rate is indicative of rapid, exponential growth, as it requires more revenue each and every month to sustain the same growth rate.
MRR Growth Rate is one of the the top metrics SaaS companies should track because it answers the question ‘How fast is the company growing?'
Tomasz Tunguz, Redpoint Ventures

7) Net New MRR
MRR Growth Rate is useful, but it can be misleading. True exponential growth is extremely rare, and in the early days of a SaaS startup (when your revenue generation is low in absolute terms), reporting on this figure can conflate true exponential growth with step improvements to your revenue: after all, it's easy to double your MRR for several months when your starting point is $100.
For most SaaS businesses, it's more useful to report on the amount of new revenue generated each month, as opposed to the percentage growth rate that revenue represents. This is done by breaking down your MRR figures, and grouping together MRR from different sources:
- New MRR is revenue gained from new subscriptions.
- Expansion MRR is revenue gained as a result of successful upselling and cross-selling.
- Churned MRR is revenue lost as a result of customers cancelling their subscription.
- Contraction MRR is revenue lost as a result of customers downgrading their subscription.
- Reactivation MRR is revenue generated by a previously churned customer returning to a paid subscription.
Using this information, we can then calculate Net New MRR: the additional MRR generated, after we've taken into account MRR lost to churn.
$$\text{Net New MRR }=\text{New MRR + Expansion MRR - Churn MRR}$$
For example, if we generated $10,000 in new MRR, and an additional $1,000 in upselling revenue, but lost $2,000 as a result of churn, we'd have a Net New MRR figure of $9,000:
$$\text{Net New MRR }=10000+1000-2000=9000$$
Christoph Janz, The Angel VC
8) SaaS Quick Ratio
The SaaS Quick Ratio is designed to compare your revenue growth over a particular time period (as shown by New MRR + Expansion MRR) with your revenue shrinkage over the same timeframe (as shown by Churned MRR + Contraction MRR).
$$\large\text{SaaS Quick Ratio}=\frac{(\text{New MRR}_t+\text{Expansion MRR}_t)}{(\text{Churned MRR}_t+\text{Contraction MRR}_t)}$$
Devised by Social Capital founder Mamoon Hamid, it creates a simple ratio of growth to churn, and provides a clear indicator of the health of your revenue growth, and not just its speed.
For example, imagine your revenue is growing by $1,000 per month. We might assume that growth would break down as follows:
$$+1000\text{ New MRR, }-0\text{ Churned MRR}$$
But there are all-manner of other ways that growth could be happening:
$$+2000\text{ New MRR, }-1000\text{ Churned MRR}$$
$$+5000\text{ New MRR, }-4000\text{ Churned MRR}$$
Though the overall growth rate is the same, the underlying health of these businesses is very, very different. The last company is having to generate $4,000 of new revenue, each and every month, just to keep its head above water.
If you're looking for something to aim for, analysis of real-world SaaS Quick Ratios showed that successful, fast growing SaaS companies sustain an average Quick Ratio of 3.9.
...If the company has a Quick Ratio of 4, they’re growing at a healthy rate, and have a low enough churn rate for me to invest.
Mamoon Hamid, Social Capital
9) Burn Rate
Burn Rate refers to the rate at which companies use their cash supply over time.
There are two types of Burn Rate metrics commonly used in SaaS:
- The Gross Burn Rate refers to the amount of money a company spends in a month.
- The Net Burn Rate refers to the amount the company loses in a month (Gross Burn Rate - Revenue). If earned revenue is greater than the amount spent in a month, Net Burn will be negative.
Burn Rate is particularly important to investors because it provides an indication of when a startup should look to raise its next round of startup funding. For example, with a Net Burn Rate of $200,000, and $2 million in the bank, the company has 10-months of cash remaining (often referred to as the company's "cash runway"). If that burn rate increased to $400,000, the runway would be reduced to 5-months.
Some SaaS founders also choose to make the distinction between Base Burn Rate and Growth Burn Rate:
Base Burn is the amount of money the company spends to operate: real estate, salaries, benefits, legal fees - all of the operating costs of the business.
Growth Burn includes the marketing and sales costs of new customer acquisition.
Founders managing their business this way aim to drive the business to profitability on Base Burn. Facing a cash shortage, the startup could cut all new customer acquisition to generate profit.
Tomasz Tunguz, Redpoint Ventures
10) Zero Cash Date
Zero Cash Date (ZCD) is the predicted date your startup runs out of cash, as a result of your current burn rate, and assuming no new revenue generation.
Your ZCD provides an indication of when new funding should be sought, and as your startup becomes cashflow positive and builds up its cash reserves, your ZCD should move further and further into the future.
11) Cost of Goods Sold (COGS)
COGS refers to the Cost of Goods Sold: all of the expenditure associated with serving customers and delivering your solution. For a software-as-a-service business, the most common COGS include:
- Application hosting fees.
- Third-party web fees (like CDNs or licensing for products embedded in the application).
- Customer support costs.
12) Gross Margin
Working out your COGS is an important part of calculating your Gross Margin: the percentage of your revenue left over after the cost of servicing that revenue (i.e. the costs of delivering the service that generated the revenue) is taken into account.
$$\text{Gross Margin %}=\frac{\text{Revenue}-\text{COGS}}{\text{Revenue}}$$
For example, if a company generated $50,000 of revenue over a particular period, and had to spend $7,000 on hosting and $3,000 on customer support over that same period, their Gross Margin on that revenue would be 80%, or $40,000.
$$\text{Gross Margin %}=\frac{50000-(7000+3000)}{50000}=80\%$$
High gross margins are a hallmark of software-as-a-service businesses, and the higher your gross margin, the more revenue you have available to invest back into growth.
If the company is an ecommerce business with 20% gross margins (commodity products) vs a SaaS business with 80% gross margins, every additional dollar of revenue for the SaaS business is equivalent to four dollars in the ecommerce business (due to the much higher contribution margin).
Margin is one of the main reasons a $10 million revenue company can be more valuable than a $100 million revenue company.
David Cummings

{{cta('b6d3f46d-0e7a-4661-94e3-4728dcd90a07','justifycenter')}}
SaaS Marketing Metrics
Bill Macaitis, Slack
...the way I’ve always looked at it is that marketing is really the fuel to the fire. Once you’ve got great product/market fit, marketing and all the different tools that we have, everything from advertising to nurturing to conversion rate marketing to split testing to positioning messaging, those are all the tools that can help just accelerate that growth further.

Rapid, large-scale customer acquisition is a pre-requisite for growth, and these marketing-specific SaaS metrics are designed to help you understand and improve your ability to generate new visitors, leads and customers.
As well as providing insight into customer acquisition, these SaaS metrics will help determine the quality of your leads. After all, SaaS marketing and sales shouldn't exist in seperate silos, and website visitors and leads don't mean a thing unless they turn into paying customers.
With both functions having a crucial (and overlapping) role to play in achieving growth, it's important to choose metrics that cover both camps.
Understanding Funnel Metrics
Let's say you have a goal of 100 new customers this year. In order to reach those 100 customers, you might need 200 engaged, ready-to-buy leads: after all, not everybody you start a conversation with ends up a paying customer.
Working backwards, to generate those 200 sales-qualified leads, you might need to collect the contact details of 400 people, some of whom will have a serious interest in your products, while others will require a bit more time to reach the same place. To generate those 400 leads, you might need 2,000 website visitors.
Understanding how this progression through the sales funnel happens allows you to predict the number of visitors and leads you'll need to actually hit your sales targets, and gives direction to your marketing strategy.
You will want to measure the number of prospects going into each stage, and the conversion rate to the next stage. You will also care about the overall conversion rate of prospects from the top of funnel to closed deal, and the average deal size.
The shape of your funnel will likely vary for each different lead source, e.g. leads from Facebook ads may not convert well into trials, but those that do convert to trials may have a higher conversion rate to closed deals than normal web traffic, and the deal sizes may be larger. That means you will need to track the funnel metrics separately by lead source.
These metrics will show you your funnel blockage points, and help you understand whether your actions to improve funnel flow are working.
David Skok, Matrix Partners

13) Unique Website Visitors
Unique website visitors refers to the number of distinct people that visit your website over a particular period of time (commonly a month).
Visitors come in all shapes and sizes, from sales-ready buyers to sceptical researchers (and even a few people who’ve ended up on your site by mistake). In order to determine which visitors are which, and identify potential customers, it's essential to learn more about them.
14) Email Subscribers
Email subscribers are visitors who’ve signed up for your newsletter, mailing list or blog updates. Though they've parted with their contact details, they haven't shown any indication of sales intent, or interest in your SaaS product, making them distinct from leads.
15) Leads
Leads are essentially visitors who have willingly transitioned from passive observers to active participants in your marketing funnel. By filling out a contact form—often in exchange for a valuable resource such as an e-book, a white paper, or a free trial—they demonstrate a certain level of interest in what you have to offer. Instead of simply browsing your content and moving on, these individuals have taken a step forward, indicating that they are potentially more qualified prospects than the average website visitor.
In providing their contact information, leads go beyond just surrendering their email address. They frequently share additional personal and professional details like their name, job title, and even their company’s website or business name. This wealth of data gives you an opportunity to gain insights into their professional context, tailor your communications, and create a more personalized experience. Ultimately, leads represent an invaluable asset: they are not merely page views or click-throughs, but real people who have shown genuine interest in building a relationship with your brand.
16) Marketing Qualified Leads (MQLS)
MQLs, or Marketing Qualified Leads, are prospects who have not only demonstrated the right demographic and firmographic characteristics of a potential customer but have also shown genuine interest in your product or service. This interest often manifests itself through tangible actions on your website or marketing channels. For example, they may spend time browsing product-specific sections, such as case studies that showcase your solution in action, or pricing pages that detail the cost and value of what you offer. Additionally, these leads might engage with various product-focused content offers, such as downloadable guides, comparison charts, or trial sign-ups, further signaling that they’re evaluating your business as a viable option.
This heightened level of engagement, combined with appropriate demographic alignment, elevates MQLs beyond the status of casual visitors and leads. By scrutinizing which pages they view and what content they consume, you can infer their place in the buyer’s journey and gauge their level of readiness to progress in the sales funnel. Equipped with these insights, your marketing and sales teams can implement more personalized and effective outreach, ensuring that MQLs are guided towards a conversation with sales representatives at just the right moment. Ultimately, MQLs represent a critical stepping stone in the pipeline, standing at a juncture where marketing’s influence begins to intersect with direct sales engagement.
17) Sales Qualified Leads (SQLS)
SQLs, or Sales Qualified Leads, are those who have not only met the initial marketing qualification criteria but have taken clear steps towards a potential purchase. These leads stand out because they have moved beyond merely exploring your content and offerings; they have actively signaled a readiness to engage with your sales team. For instance, a lead may request a one-on-one consultation, sign up for a product demo, or directly inquire about pricing and implementation. Such actions provide concrete evidence that the prospect is interested in learning more about how your solution can address their specific challenges.
This shift in engagement from casual exploration to explicit outreach represents a pivotal moment in the sales process. By this point, an SQL has typically gathered enough information about your product, has evaluated its relevance to their problems, and is now eager to engage in more in-depth discussions. As a result, these leads warrant immediate attention from your sales team, who can now focus on understanding the prospective customer’s unique needs and guiding them toward a tailored solution. Ultimately, SQLs carry a higher likelihood of conversion, making them indispensable assets in moving your pipeline toward successful, revenue-generating outcomes.
18) Opportunities
Opportunities represent a critical turning point in the lead-to-customer journey. Once a Sales Qualified Lead has been handed over to the sales team, the team carefully evaluates their needs, timing, budget, and decision-making capabilities. Through conversations, assessments, and initial rapport-building, the sales team determines whether the prospect is a true potential buyer who is worth pursuing further. When a lead clears this vetting process and is confirmed as a high-value candidate for conversion, they officially become an opportunity. At this stage, the lead is no longer just a name in the database, but rather a viable deal that can be actively pursued.
This transition into an opportunity marks the beginning of a more structured and intentional sales process. The sales team can now delve deeper into understanding the prospect’s unique challenges, demonstrate how their software can meet these challenges, and outline potential solutions tailored to the customer’s specific needs. From here, both sides engage in more substantive discussions, negotiations, and solution positioning. By labeling a lead as an opportunity, the organization commits additional time and resources towards winning this account, knowing that the effort is justified by the likelihood of a successful and mutually beneficial partnership.
19) Paying Customers
These are people that have signed on the dotted line and comitted to paying for your service for a particular length of time. Though more of a sales metric, it's important to track how marketing-generated leads convert into paying customers, in order to assess the overall performance of your marketing strategy.
20) Free Trials & Demo Requests
Many SaaS products use free trials and demos to engage prospective customers, and it's important to understand where these fit into the sales funnel.
Free Trial users are usually counted as MQLs: signing-up for anything "free" requires relatively little committment from users, and simply kicking the tyres of your product provides no indication of sales intent.
Some SaaS products can be more complex, and require custom set-up before use. This often means that free trials aren't viable, and instead, running product demos is a more effective way of proving out the value of your product.
Getting on the phone and sitting through a demo requires a greater committment from your visitors, so demo requests are usually regarded as SQLs. Though the distinction isn't always clear, it's important to choose a simple, consistent rule for qualification, and stick to it.
If marketing drove those leads and got them to the point where they’re “qualified” ... it should be designated a Marketing Qualified Lead (MQL).
If someone from the sales organization manually did the qualification ... regardless of the lead source, call it a Sales Qualified Lead (SQL).
Lincoln Murphy, Sixteen Ventures
Understanding Conversion Rates
There are two ways to generate more customers: increasing the number of people entering the sales funnel, and improving the rate at which visitors turn into leads, and leads turn into customers.
Though lead and customer acquisition should always be a priority, it's often possible to generate more leads and customers, at a lower cost, by improving your conversion rates. The first step in improving conversion rates is to track them at crucial points of your sales funnel.
21) Visitor to Lead
The rate at which website visitors convert into leads. Tools like pop-ups, email subscriptions, free downloads and landing pages can all be used to convert anonymous visitors into identifiable leads, and it's important to optimise this conversion rate over time.
$$\text{Visitor to Lead conversion rate}=\frac{\text{Number of Leads}}{\text{Number of Visitors}}$$
22) Lead to Customer
This is an overarching conversion rate that looks at the rate at which leads convert into customers. Generating lots of poor-fit leads will lead to an extremely low conversion rate, and vice versa, so this can offer a very revealing insight into the quality of the leads you're generating.
$$\text{Lead to Customer conversion rate}=\frac{\text{Number of Customers}}{\text{Number of Leads}}$$
23) MQL to SQL
This shows the rate at which marketing-qualified leads turn into sales-qualified leads, and it can provide useful insights into lead quality and the performance of your sales development reps.
$$\text{MQL to SQL conversion rate}=\frac{\text{Number of SQLs}}{\text{Number of MQLs}}$$
24) Free Trial to Paid Customer
This is the rate at which free trial users become paying customers. Small improvements to this figure will generate big improvements in revenue, so it's important to continually optimise your free trial onboarding process.
$$\text{Free Trial to Customer conversion rate}=\frac{\text{Number of Customers}}{\text{Number of Free Trials}}$$
Guy Nirpaz, Totango
For a B2B SaaS company with free trial, I assume the following ball park figures:
- 3%-5% - average and means good business operations
- 8% and above - excellent conversion rates
- below 3% - below average

25) Marketing Spend:Average Contract Value
The ratio of your marketing spend to Average Contract Value (which I'll go into below) is useful for tracking how expenditure on marketing channels translates into sales revenue.
$$\text{Marketing Spend:Annual Contract Value}$$
26) Month-on-Month MQL Growth Rate
Month-on-Month MQL Growth Rate refers to the rate at which Marketing Qualified Leads are growing over time.
$$\text{MoM MQL Growth Rate}=\frac{\text{MQLs}_t-\text{MQLs }_{t-1}}{\text{MQLs }_{t-1}}\times100$$
For example, if we generated 100 marketing qualified leads last month, and 110 this month, we'd have month-on-month MQL growth of 10%.
$$\text{MoM MQL Growth Rate}=\frac{110-100}{100}\times100=10\%$$
27) Month-on-Month SQL Growth Rate
As well as tracking the MQL growth rate, we can also track the rate of growth of sales-qualified leads (SQLs):
$$\text{MoM SQL Growth Rate}=\frac{\text{SQLs}_t-\text{SQLs }_{t-1}}{\text{SQLs }_{t-1}}\times100$$
For example, if we generated 50 sales qualified leads last month, and 60 this month, we'd have month-on-month SQL growth of 20%.
$$\text{MoM SQL Growth Rate}=\frac{60-50}{50}\times100=20\%$$
SaaS Sales Metrics
One of the myths of SaaS is that the products are so good, so easy to use, so quick to deploy … that the product sells itself. Given the popularity of try-before-you-buy and freemium-to-premium models for software as a service, it’s easy to see where that myth comes from.
But as many startups discover to their horror — after they “land” users and try to “expand” to more departments in a large company or government agency — this is far from the truth. Even with early viral growth, SaaS products don’t sell themselves.
Mark Cranney, Andreessen Horowitz

No matter how "sticky" or "viral" your app becomes, the continued growth of your SaaS business will depend on effective sales processes.
The SaaS metrics collected here will help you determine everything from the efficiency of your sales team through to the validity of your pricing model. Crucially, they'll also give you much needed insight into your customers, in terms of their expected lifetime, profitability and value.
After all, there's more to scaling a SaaS business than acquiring customers: you need to acquire the right types of customer.
28) Annual Contract Value (ACV)
Annual Contract Value looks at the value of a customer's contract over a 12-month period.
For example, if a customer committed to a 24-month contract of $60,000, that contract would generate $2,500 in MRR ($60,000/24 months) and $30,000 in ACV ($60,000/2 years).
29) Total Contract Value (TCV)
TCV stands for Total Contract Value, and looks at the value of a customer's contract over its entire duration.
Returning to the example above, our customer's 24-month contract of $60,000 has a TCV of $60,000. If, at the end of their contract, that same customer purchased a different product, paying $10,000 for a 6-month period, the TCV of that contract would be $10,000.
Unlike measurements of recurring revenue, both TCV and ACV measure all revenue generated during the chosen timeframe: including one-off payments and charges.
30) Average Revenue per Account (ARPA)
ARPA stands for Average Revenue Per Account, and is used to measure how much revenue is contributed by an "average" account or customer, per month. Changes to ARPA can be helpful for tracking growth and revenue generation on a per unit basis.
$$\text{ARPA}=\frac{\text{MRR}}{\text{Number of active accounts}}$$
It's helpful to track ARPA seperately for both new customers and existing customers. This makes it easy to compare the characteristics and revenue generation of your customers over time: seeing how they respond to upselling and cross-selling over their lifetime.
31) Average Selling Price (ASP)
ASP stands for Average Selling Price (or Average Sale Price). Where ARPA looks at the average amount of revenue a customer contributes during the course of a month, ASP measures the average initial price that customers pay at the time of sales conversion:
$$\text{ASP}=\frac{\sum\text{Deal Revenue}}{\text{Number of deals}}$$
Understanding your ASP is the key to determining the right sales model for your SaaS startup - self-service, transactional or enterprise - as your ASP places a limit on the Customer Acquisition Cost you can justify (more on that below). A high ASP makes high-touch sales strategies viable, and a low ASP forces you towards a self-service model.
Joel York, Chaotic Flow
I don’t know any single statistic that provides more insight on a SaaS startup, or any business for that matter, than average selling price (ASP).

32) Customer Acquisition Cost (CAC)
Customer Acquisition Cost (CAC) is designed to tell you how much you need to spend to acquire a single new customer.
For most B2B SaaS businesses, the costs of acquiring a new customer are determined by two factors:
- The costs of generating a lead (usually determined by marketing expenses).
- The costs of converting that lead into a customer (normally a result of sales costs, or touch costs - the salaries of sales development reps or field sales people).
Typically, the easiest way to work out the cost of securing a single new customer is to bundle together the total sales and marketing expenditure in a given time period (period t), and divide it by the total number of new customers.
$$\text{CAC}_t=\frac{\text{Sales and Marketing Cost}_t}{\text{New Customers}_t}$$
For example, if you spent $5,000 apiece on sales and marketing in a given month, and closed 10 new customers over that same time period, that month's Customer Acquisition Cost would be $1,000:
$$\frac{5000+5000}{10}=1000$$
CAC and Customer Success
Most CAC calculations intentionally exclude the costs and revenue associated with customer success strategies.
Although customer success teams generate (often significant) revenue, through upselling, cross-selling and encouraging renewals, CAC is designed to measure your ability to generate new revenue from sales and marketing expenditure.
Adding customer success into the calculation distorts that measurement, so it's best to track separately.
Free vs Paid Customers
If you generate leads from both paid and unpaid channels, it's important to calculate acquisition cost separately for each.
With 100 "free" customers (generated with a $0 CAC) and 20 customers at $500 CAC, the average CAC is roughly $83. This "blended" CAC is accurate, but in terms of understanding your sales and marketing strategies, pretty useless.
Dave Kellog's Alternative CAC
Instead of generating an abstract dollar value, Dave Kellogg recommends an alternative CAC calculation that compares your sales and marketing expenditure in the previous period (S&Mt-1) to the new revenue generated in the current period (New ARRt).
This effectively tells you how much you're spending to generate a single dollar of new customer revenue:
$$\text{CAC}_t=\frac{\text{Sales and Marketing Cost}_{t-1}}{\text{New ARR}_t}$$
For example, if you spent a combined total of $10,000 on sales and marketing last month, and generated $12,000 in new revenue this month, that means that for every $1 of new revenue, you had to spend $0.83 to attain it.
$$\frac{5000+5000}{12000}=0.83$$
However, if you’re selling sticky enterprise infrastructure, replacing systems that have been in place for a decade with applications that might well be in place for another decade, then a CAC is 2.0 is probably fine.
That’s the point: there is no absolute right or wrong answer to what a company should be willing to pay for a customer. What you are willing to pay for a customer should be a function of what they are worth.
Dave Kellogg, Host Analytics
33) CAC Payback Period
Customers will only become profitable when they've generated enough revenue to cover their acquisition cost, and it can be extremely helpful to work out how long this "payback period" will be.
The formula for the CAC Payback Period (also referred to as Months to Recover CAC) is straightforward: just divide the cost of acquiring a customer by the monthly revenue they generate, to work out how many months' revenue it requires to break-even.
$$\text{CAC Payback Period}=\frac{\text{CAC}}{\text{MRR per customer}}$$
For example, with a customer acquisition cost of $2,000, and an average monthly revenue per customer of $150, it'll take just over a year for each customer to become profitable:
$$\text{CAC Payback Period}=\frac{2000}{150}\approx13\text{months}$$
34) Gross Margin Adjusted Payback Period
Although your MRR is going towards paying back your acquisition cost, it's also contributing to the extra costs associated with providing your service (COGS, #11).
By factoring the Gross Margin into our formula, we can calculate a more accurate payback period:
$$\text{Gross Margin Adjusted Payback Period}=\frac{\text{CAC}}{(\text{MRR per customer}\times\text{Gross Margin})}$$
Using the CAC Payback Period example from earlier, and a gross margin of 70%, we now generate a CAC payback period of 19 months: 6 months longer than previously estimated, as a result of the COGS your MRR needs to cover.
$$\text{CAC Payback Period}=\frac{2000}{150}\approx13\text{months}$$
$$\text{Gross Margin Adjusted Payback Period}=\frac{2000}{150\times0.7}\approx19\text{ months}$$
David Skok, Matrix Partners
Aim to recover your CAC in < 12 months, otherwise your business will require too much capital to grow.
35) Customer Lifetime Value (LTV)
LTV (sometimes referred to as CLTV or CLV) stands for Customer Lifetime Value: the total amount of revenue generated by a single customer over the life of their subscription to your SaaS product.
LTV shows you how much each customer is contributing to your revenue, and for how long, and guides how much you should be spending to acquire them (more on that in the next metric). By segmenting LTV by different customer types and buyer personas, you can also hone in on your most valuable customers.
$$\text{LTV}=\frac{\text{ARPA}}{\text{Customer churn rate}}$$
For example, with an Average Revenue Per Account of $200, and a 10% Customer Churn Rate, we'd generate a Lifetime Value of $2,000:
$$\text{LTV}=\frac{200}{0.1}=2000$$

36) LTV:CAC
Neither CAC nor LTV mean much in isolation: you can only work out how "good" your CAC is in relation to the revenue those customers generate (LTV).
$$\text{LTV:CAC}$$
For example, if your customer's lifetime value was $2,000, and it cost $1,000 to acquire that customer, that's an LTV:CAC ratio of 2:1.
$$$2,000:$1,000$$
$$2:1$$
It makes sense that your LTV should always be greater than your CAC: few businesses want to lose money on every customer they acquire.
Beyond this, past performance suggests that LTV needs to be about 3x CAC for a SaaS business to survive. Best-in-class performers (like Salesforce and Constant Contact) do even better, with multiples closer to 5x.
An important note here is that your LTV can be lower than your CAC in certain instances, but all of those hinge on you eventually making up the deficit through new products, features, revenue sharing, etc.
Additionally, some venture backed companies forgo LTV for extremely high CAC to run a "scorched earth" strategy of acquiring logos. This is risky, but an effective strategy if you're in a "winner take all" type market.
Jordan T. McBride, Price Intelligently

37) Win Rate
Your Win Rate is used to provide a simple look at sales efficiency, and the ability of your sales reps to close deals. It looks at the number of deals won, as a percentage of total deals (those won and lost). It can also be calculated using the dollar value of those deals:
$$\text{% Win Rate}=\frac{\text{Won Opportunities}}{\text{Won Opportunities}+\text{Lost Opportunities}}$$
Obviously, a high win rate is indicative of an effective sales team and a high lead quality. But in the early days of your SaaS startup, a high win rate isn't always something to aim for. Instead, it's likely a sign that you're coasting along, relying on easy deals instead of pushing into new segments and markets.
When you first start, it will seem like you win almost every deal — because you aren’t in very many.
Then as you scale, you actually want your overall win rate to go down (while maintaining your lead in your core segments of first traction).
And then go back up once you’re much, much bigger and win the bigger prize.
Jason Lemkin, SaaStr

38) Sales Commission:ACV
When it comes to scaling your sales team, there's a simple mathematical constraint in operation: sales people need to sell more than they cost.
Instead of monitoring the cost of your sales team in isolation, you can instead measure sales commission as a percentage of Annual Contract Value (ACV), and directly relate sales costs to the revenue they're involved in generating.
$$\text{Sales Commission:ACV}=\frac{\text{Sales Commission}}{\text{Annual Contract Value}}$$
For example, with a sales commission of $500, and an Annual Contract Value of $5,000, sales commission would be 10% of ACV (or 10:1 - roughly the median sales commission:ACV ratio in SaaS).
$$\text{Sales Commission:ACV}=\frac{500}{5,000}\times100= 10\%$$
I've worked with salespeople, who come from large organizations, often demand commission rates in the 20%-25% range.
Unbeknownst to startups, these rates aren't "market" in the SaaS world. In fact, that median sales commission is roughly 9% of Annual Contract Value (ACV) for the past two years.
Ryan Fukushima, VC, Lightbank

39) Sales Efficiency
Sales efficiency is often referred as the "Magic Number" of SaaS, because it offers a clear, simple way to understand the return generated by your growth (in terms of sales and marketing) investments.
$$\text{Sales Efficiency}=\frac{\text{Revenue}\times\text{Gross Margin %}}{\text{Sales and Marketing Costs}}$$
For example, if a SaaS company generates $1.25 million in revenue with an 80% Gross Margin, and spends a total $500,000 on sales and marketing, they'd have a sales efficiency of 2.
$$\text{Sales Efficiency}=\frac{1250000\times 80\%}{250000 +250000}= \frac{1000000}{500000}= 2$$
Sales Efficiency is the inverse of the payback period: the length of time it takes for customers to "pay back" the costs of acquiring them. For a good benchmark to aim for, a magic number of 1 means that sales and marketing expenditure will be recouped by customer revenue in the next four quarters.
Tomasz Tunguz, VC, Redpoint
Most SaaS companies operate around the 0.8 mark, meaning the business pays back the cost of the revenue and sales expense in the 5 quarters of the customer.
40) Revenue per Lead
Revenue Per Lead allows you work out the average amount of revenue each lead (as opposed to customer) will contribute. By calculating Revenue per Lead on a per-sales-person basis (using only their active leads as a sample), it provides a great insight into the efficiency of your entire sales team (and the types of leads they're tasked with closing).
$$\text{Revenue Per Lead}=\frac{\text{ACV}}{\text{Number of leads}}$$
I'd recommend calculating Revenue per Lead using cohort analysis: looking at the ACV revenue generated by a particular "batch" of leads (say leads generated in January), as opposed to dividing ACV (a product of closed deals and thus "old" leads) by your current leads.
But if you don’t measure it down to the individual rep level and you just look at MRR, you’re missing an opportunity to improve things.
Jason Lemkin, SaaStr
41) Lead Velocity Rate
Many of the metrics we use to assess (and predict) our growth are actually stuck in the past.
In the same way that light from distant stars shows us a picture from millions of years ago, most sales and revenue metrics reflect deals that were created months and years past.
In other words, if you're trying to use current sales deals to predict future sales, you're using outdated information, and obsessing over opportunities created by your old sales and marketing strategies, not your current approach.
Lead Velocity Rate (also known as Lead Momentum or Qualified Lead Growth) is a quick and simple way of measuring the month-on-month growth of your lead generation:
$$\text{LVR}=\frac{\text{Qualified Leads}_{t}-\text{Qualified Leads}_{t-1}}{\text{Qualified Leads}_{t-1}}\times100$$
For example, if we generated 100 qualified leads last month (t-1), and 110 this month (t), we'd have a lead velocity rate of 10%:
$$\text{LVR}=\frac{110-100}{100}\times100=10\%$$
Your MRR growth is great, but really that just tells you about the present – how you’re doing now. But if your leads are growing faster than your revenue, I can see the future growth.
Being able to quantifiably track the velocity of qualified leads is going to be your best possible indicator as a CEO of where you’re going to be in the future.
Jason Lemkin, SaaStr
SaaS Customer Success Metrics
...“customer success” is one of those vague terms that seems like it was invented when we needed a buzzword to describe what successful businesses have been doing forever.
But just because it’s a buzzword doesn’t mean that it’s not absolutely critical to focus on. It is.
Almost every successful software company that I can think of has gotten to where they are – or at least to initial traction – on the success of their customers.
Alex Turnbull, Groove

Customer acquisition can feel like the be-all and end-all for growth-hungry startups, but the bigger you get, the harder it becomes to maintain the same rapid growth rates.
Customer acquisition alone isn't enough to sustain your growth, and when you start to gain traction, it's essential for your priority to shift. Instead of continuing to fixate on your sales and marketing strategies, it's time to focus on Customer Success: fuelling growth through the retention and upselling of your existing customers.
These SaaS metrics are designed to understand customer behaviour - how (and why) they're engaging with your business - allowing you to improve the value your business delivers to its customers, and grow your revenue as a result.
42) Daily Active Users (DAU)
DAU stands for Daily Active Users, and it's a simple measurement of the number of active users on a given day (period d):
$$\text{Daily Active Users}=\text{Number of Active Users}_d$$
The key to creating a helpful DAU or MAU metric is to carefully define how users qualify as "active". Many SaaS companies use DAU to count the number of users who logged in on a particular day, without differentiating between a user that logs in to use every aspect of their product's functionality, and another that logs in to send support requests and delete their data.
While this can be helpful for simple reporting purposes, it does almost nothing to reveal how engaged users actually are with your product, or predict retention rates and at-risk customers.
Instead, it's better to create a more discerning definition of "active". Though this will reduce the size of your DAU or MAU measurement, it creates a much more useful metric.
43) Monthly Active Users (MAU)
MAU is the monthly counterpart to DAU, and stands for Monthly Active Users: a measure of the total number of "active" users in a given month (period m).
$$\text{Monthly Active Users}=\text{Number of Active Users}_m$$
While you generally need to sign-in to an app to get value, that action alone is probably not the thing that delivers value to your customer.
Simply being “active” in the product doesn’t mean you’re being “successful” either.
In fact, a lot of logins and random in-app activity could be a sign that your customer can’t figure out what to do… but they sure would like to.
It’s a signal that something’s amiss… but a lot of companies might wrongly classify that customer as “active” and therefore “onboard” and “successful.”
Lincoln Murphy, Sixteen Ventures
44) Net Promoter Score (NPS)
The Net Promoter Score (NPS) is a tool that's used to try and quantify customer satisfaction with your service. The NPS uses a simple survey question:
"How likely are you to recommend
[your SaaS product] to a friend or a colleague?"
Respondents are then asked to choose a corresponding score, on a scale from 0 ("Not at all likely") to 10 ("Extremely likely").
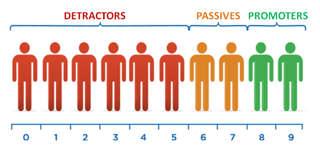
Your Net Promoter Score is then calculated by subtracting the percentage of Detractors from the percentage of Promoters. A positive score suggests more people willing to recommend your product than those trying to dissuade others from using it - you're receiving a net promotion - and vice versa.
$$\text{NPS}=\%\text{Promoters}-\%\text{Detractors}$$
For example, if 50% of responders were promoters, and 10% of respondents were detractors, your NPS would be 40:
$$\text{NPS}=50\%-10\%=40$$
According to Zendesk, the median NPS score for B2B companies is 29.
Like most SaaS companies, we use drip NPS — a few of our customers respond to an in-app NPS survey every day.
This gives us a constant pulse of feedback. The whole team gets to high-five when we get another “10.” And, if there is ever a customer issue, the product team is quick to offer support.
When everyone is aligned around customer happiness, the CSM’s job is much easier.
Jessica Pfeifer, Wootric

45) Customer Satisfaction Score (CSAT)
Unlike the Net Promoter Score, Customer Satisfaction (or CSAT) scores are used to rate individual interactions with your company. After an interaction (say a customer support conversation or closing an upselling deal), the customer is asked a simple question:
"How would you rate your overall satisfaction with the service you received?"
Respondents then score their interaction from 1 (very dissatisfied) to 5 (very satisfied). CSAT scores are then calculated by averaging out these responses:
$$\text{CSAT}=\frac{\sum \text{Customer Responses}}{5\times\text{Number of Responses}}\times100$$
For example, if we surveyed five customers about their experiences, and four responded with a 5, and one with a 3, we'd have a CSAT score of 92% (with 100% reflecting complete satisfaction):
$$\text{CSAT}=\frac{5+5+5+5+3}{5\times5}\times100=92\%$$
As your SaaS business grows, monitoring your customer interactions becomes both harder, and more important to do. CSATs can provide a simple window into the type of service you offer, and functions as a valuable complement to NPS measurements.
46) Upsell & Cross-sell Rate
The Upsell Rate allows you to calculate the percentage of a period's revenue that was generated from upselling: encouraging existing customers to increase their spend, by purchasing more seats, more storage space, going to a higher-priced tier, etc.
$$\text{Upsell Rate}=\frac{\text{ACV of Upsells}_t}{\text{Total ACV}_t}$$
For example, if we generated $10,000 in Annualised Contract Value over a single month, and $2,500 of that revenue can from upselling, the upsell rate would be 25%:
$$\text{Upsell Rate}=\frac{2500}{10000}\times100=25\%$$
The same calculation can be applied to cross-selling, to work out the proportional revenue generated by encouraging customers to take-up complementary services (like purchasing an invoicing product to work alongside their recurring billing tool):
$$\text{Cross-sell Rate}=\frac{\text{ACV of Cross-sells}_t}{\text{Total ACV}_t}$$
Emily Triplett Lentz, Help Scout
Doing right by our customers is priority numero uno, so we don’t attempt to upsell unless it makes sense for our customer’s business.

47) Viral Coefficient
Customer referrals can be a powerful contributor to growth, and the viral coefficient is a way of measuring the growth of your customer base generated by successful customer referrals.
Simply put, your Viral Coefficient tells you how many new users a current user is referring to your business. Understanding and improving the viral coefficient of your SaaS solution is a crucial part of achieving explosive, 'viral' growth.
$$\frac{(\text{Number of Users} \times \text{Average Number of Referrals} \times \text{Referral Conversion Rate})}{\text{Number of Users}}$$
The example below assumes 100 users, each sending out 10 customer referrals. Those referrals convert into new paying customers at a rate of 15%, generating a Viral Coefficient of 1.5:
$$\text{Viral Coefficient }=\frac{(100\times 10\times 0.15)}{100}=\frac{150}{100}=1.5$$
A Viral Coefficient greater than one means that for every new user you acquire, you'll gain an additional user (or more) as a result of successful referrals. In this example, a coefficient of 1.5 means each new customer is, in turn, generating 1.5 additional customers as a result of the referral process.
True exponential growth is very, very rare in SaaS...
...even a modest exponential growth rate of 10% p.m. is very hard to sustain for a longer period of time.
Christoph Janz, The Angel VC
This type of truly viral growth (where growth is self-sustaining through referrals alone) is pretty unobtainable, but a viral coefficient of less than one is still hugely valuable.
Receipt tracking service Shoeboxed calculated that they had a viral coefficient of 0.2. Though not truly "viral", this still culminates in one additional referred customer for every 5 new customers, effectively increasing growth by 20%:
$$\frac{(100\times 4\times 0.05)}{100}=\frac{20}{100}=0.2$$
I’d say typically, SaaS apps don’t have enough customers to see the material, economic benefits of viral revenue until they cross $1m-$2m in ARR at the earliest. You may see hints of it before, and in your leads, but usually, there aren’t enough customers or time for it to move the needle as a material revenue contributor before then.
Now, if you’re building a free B2C app, where you need tens of millions of users to get to Initial Scale, that’s a disaster.
But in SaaS, when you’re on a 7-10 year journey to $100m in ARR, it actually doesn’t matter that much if your viral coefficient is low when you get the viral customers. Faster is better of course. But it’s all still good, so long as it comes and it’s not the only source of new customers. And when it does come, it comes on materially, and strong.
Jason Lemkin, SaaStr
48) Referral Revenue
Referral Revenue is a simple aggregate measurement of all the revenue generated by successful customer referrals, over a particular time period. Customer referrals are a cost-effective channel of growth, and it's important to aim for an increase in Referral Revenue over time.
With that said, Referral Revenue figures alone only show you simple trends in revenue; and to unlock more useful insights, it's important to compare Referral Revenue to the investment in Customer Referral that generated it.
49) Referral Return on Investment (ROI)
If we want to go a step further than calculating Referral Revenue, we can use Referral Return on Investment (ROI) to compare the amount we're spending on customer referrals with the revenue those referrals will generate over their lifetime.
Imagine our average customer pays $1,000/month, for a lifetime of 2 years:
$$\text{LTV }=1000\times24=24000$$
For our referral scheme, we're offering an incentive of 20% off the monthly bill ($1,000 x 0.2 = $200), for 12 months, to both successful referrals and successful referrers:
$$\text{Cost of Referral Incentive }=(200\times12)+(200\times12)=4800$$
We can use that information to work out the Referral ROI: a number that shows how many dollars in LTV we're generating for each dollar of referral marketing spend:
$$\text{Referral ROI}=\frac{\text{LTV}-\text{Referral Incentive}}{\text{Referral Incentive}}$$
Given our example above, we're generating $4.5 in LTV for every $1 we're spending on the referral:
$$\text{Referral ROI}=\frac{24000-4800}{4800}=4.5$$
50) Viral Referral ROI
Importantly though, Customer Referral programs actually increase your LTV: in addition to the direct revenue customers will generate over their lifetime, they now have a hand in generating revenue from other customers, as a result of successful referrals.
In order to improve our Referral ROI, it's a good idea to factor this into the equation. The formula below is changed in one regard: the LTV is now modulated by our Viral Coefficient, or the average rate at which existing customers generate new customers, as a result of referrals.
$$\text{Viral Referral ROI}=\frac{\text{(LTV}\times(1+\text{Viral Coefficient}))-\text{Referral Incentive}}{\text{Referral Incentive}}$$
If we generate a new customer from the referral efforts of every 5 existing customers, we'd have a viral coefficient of 0.2. This actually increases the ROI of our customer referral program, from 4.5 to 5:
$$\text{Viral Referral ROI}=\frac{(24,000\times(1+0.2))-4,800}{4,800}=5$$
A Closing Thought on SaaS Metrics
Many companies fail to track more than a handful of SaaS metrics. Others build-out huge dashboards of KPIs but pay little more than lip-service to its findings. To my mind, that's just as bad.
It's important to go beyond the shiny dashboard of graphs and green arrows, and use your SaaS metrics to positively impact your growth. It doesn't matter that you're seeing month-on-month growth of website visitors if none of them turn into leads. If you've doubled your customer acquisition but trebled your churn, you still have a huge problem.
Metrics alone won't fix anything: they're only a tool to help you make informed (and often difficult) decisions. But armed with the insight they provide, you can make a choice with as much data as possible. Whether you're optimising your pricing strategy, reducing customer churn or boosting your free trial-to-customer conversion rate, these SaaS metrics will help illuminate the right path to take.
Recommended Reading
- SaaS Metrics 2.0, ForEntrepreneurs
- Customer Acquisition: Maximizing your Funnel, ForEntrepreneurs
- Metrics that Make a Difference, Joel York
- SaaS Metrics - Definitions, Joel York
- 5 Key Sales and Marketing Metrics to Track for SaaS, Openview Partners
- Four Important Data Points On Measuring Your Startup's Customer Happiness, Tomasz Tunguz
- 16 Startup Metrics, Andreessen Horowitz
- 9 Worst Practices in SaaS Metrics, Christoph Janz
- Key Revenue Metrics for SaaS Companies, Christoph Janz
- Metrics, Dave Kellog
- 50+ Benchmarks for Software Startups, Cobloom

